I used SQL and Tableau to compare category and product profitability, then test how changes in price, unit cost, and sales volume would affect gross profit.
Fernanda Adekeu Alif · SQL / DuckDB / Tableau
Fictional Contoso data · USD transactions · Featured analysis: 2025
THE PROJECT
From sales records to useful decisions
I wanted to go beyond reporting sales totals. This project looks at which categories and products contribute to gross profit, and how sensitive that profit is to changes in commercial assumptions.
I prepared 113,614 sales order lines from the fictional Contoso dataset, keeping only USD transactions. Each row represents an order line. I used the historical net unit price and unit cost recorded in the transactions, then built three Tableau dashboards from the prepared data.
The prepared dataset includes multiple years. The findings and figures featured on this page use 2025, with all categories selected unless stated otherwise.
THE BASELINE
2025 at a glance
USD transactions · All categories
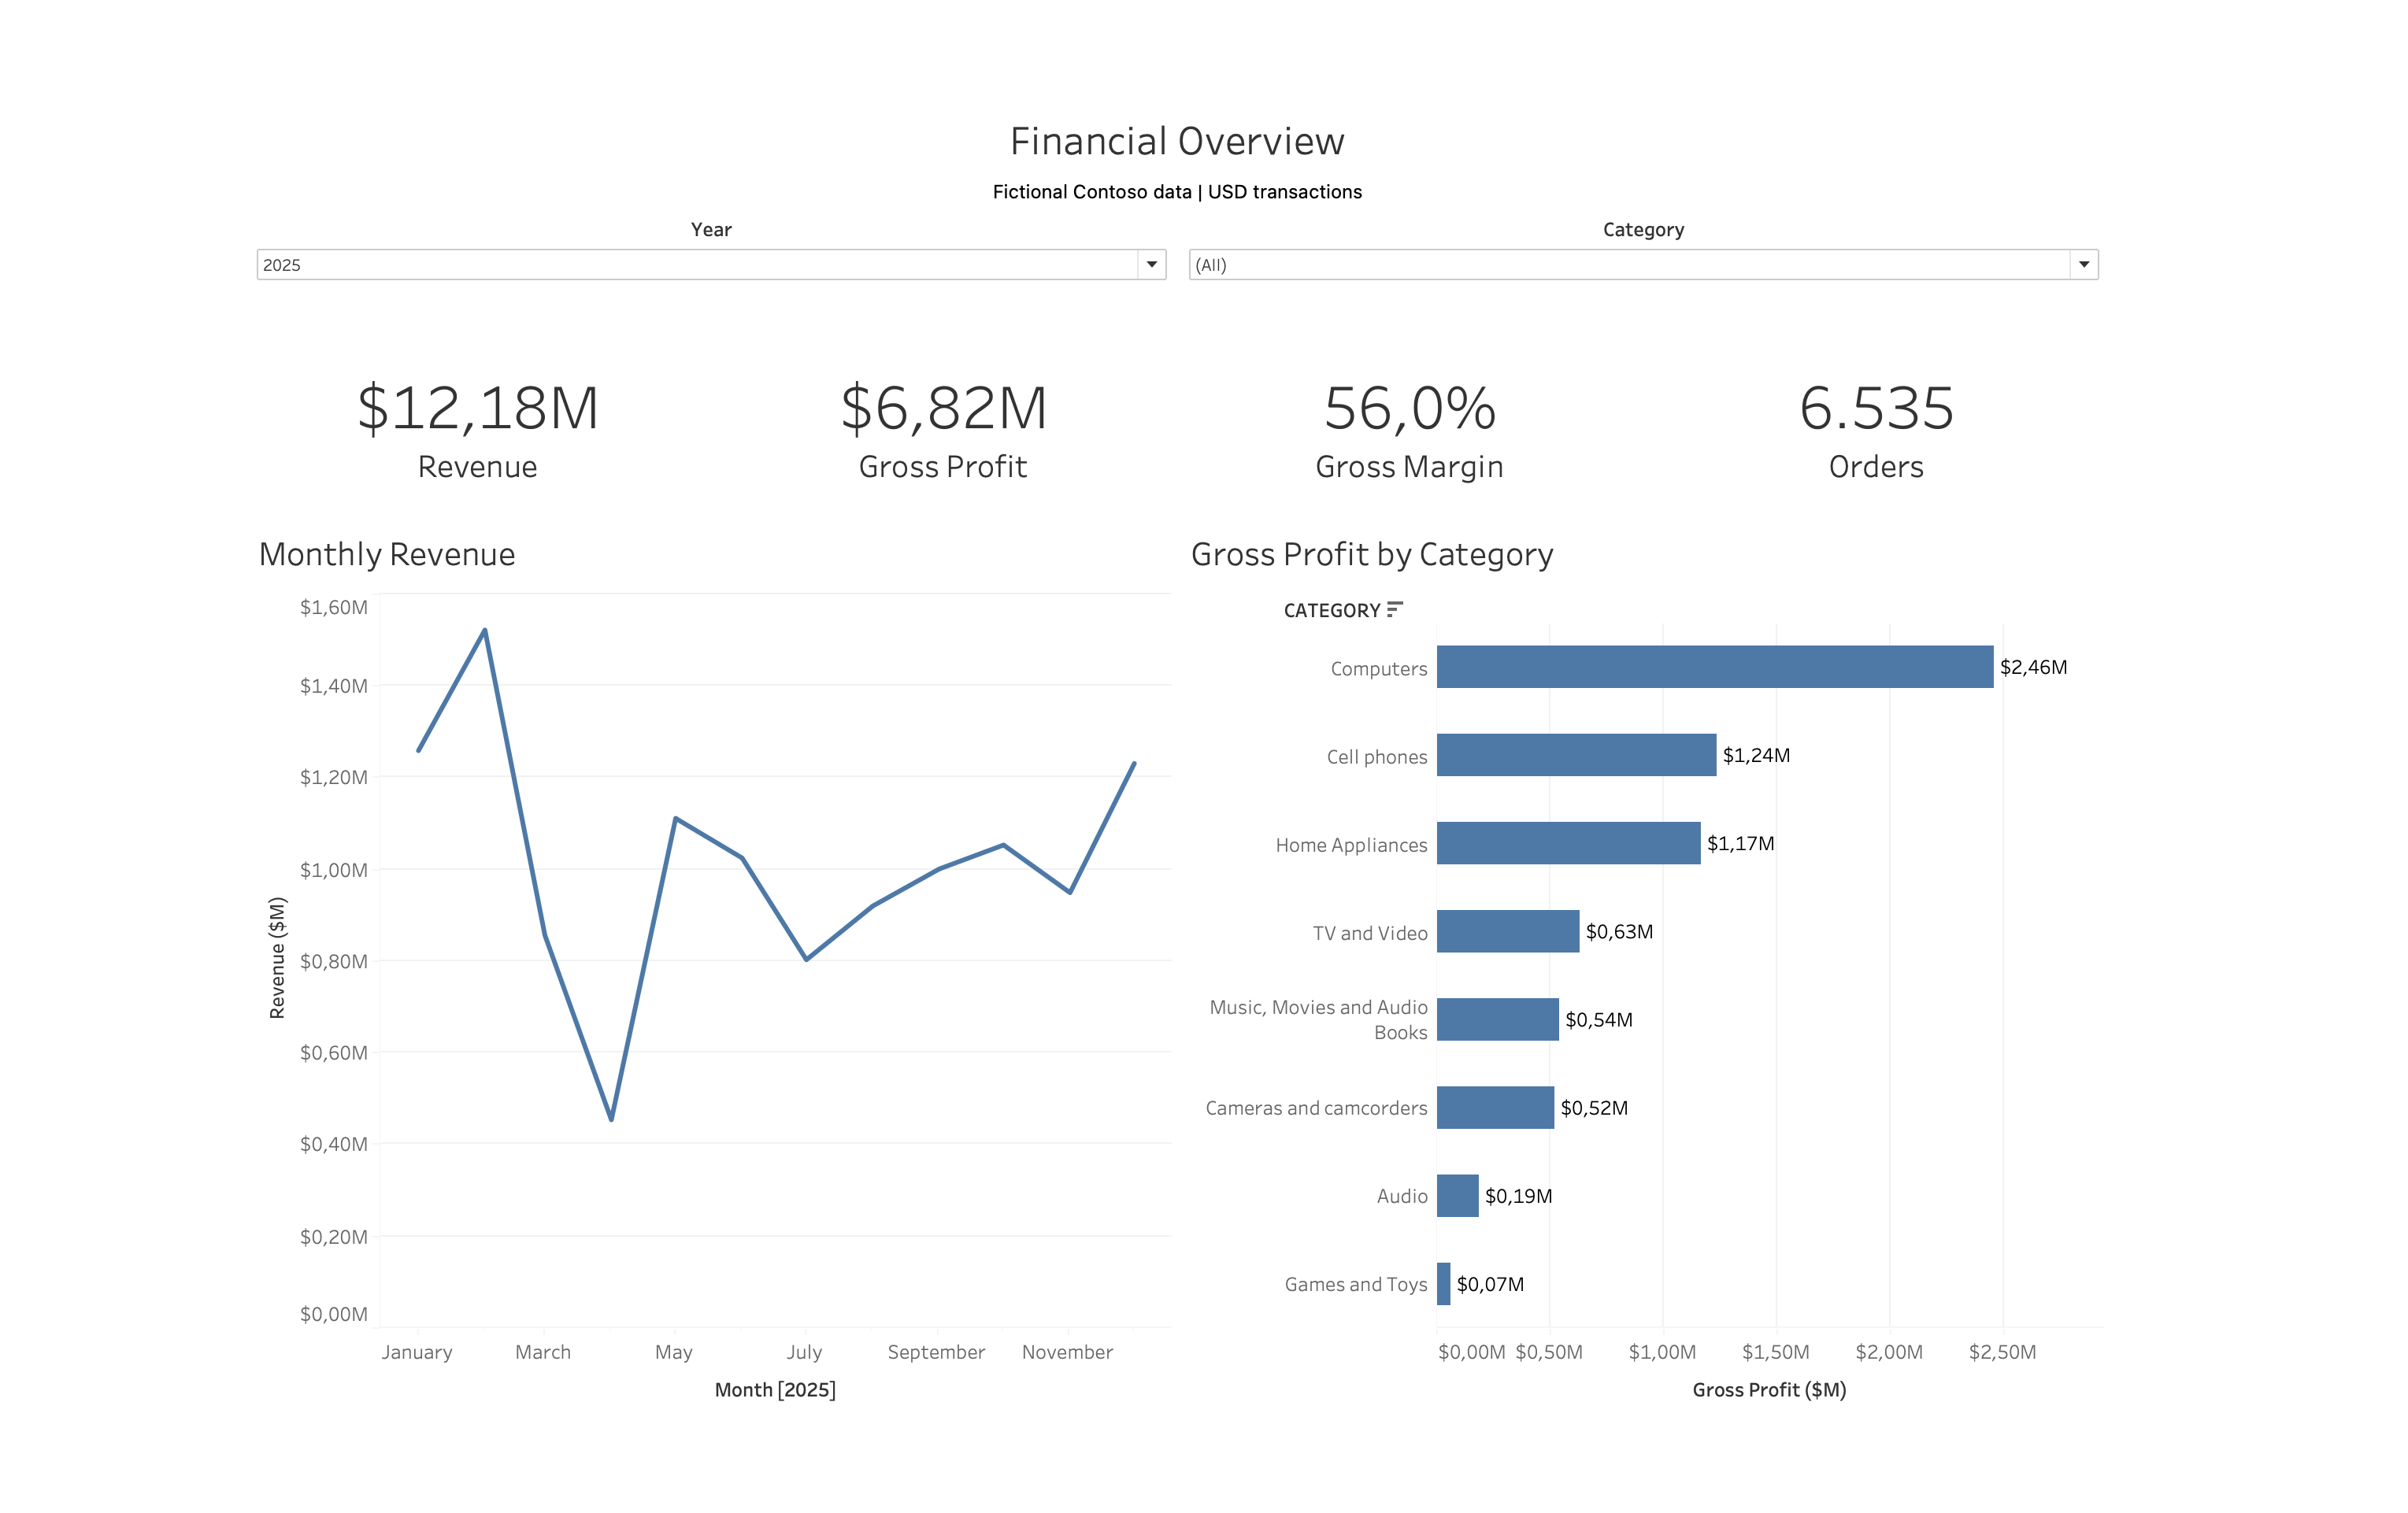
$12.18MRevenue
$6.82MGross profit
56.0%Gross margin
6,535Distinct orders
Revenue and gross profit are rounded here. Gross margin is total gross profit divided by total revenue.
WHAT I FOUND
Three findings worth looking at
01 / CATEGORY PERFORMANCE
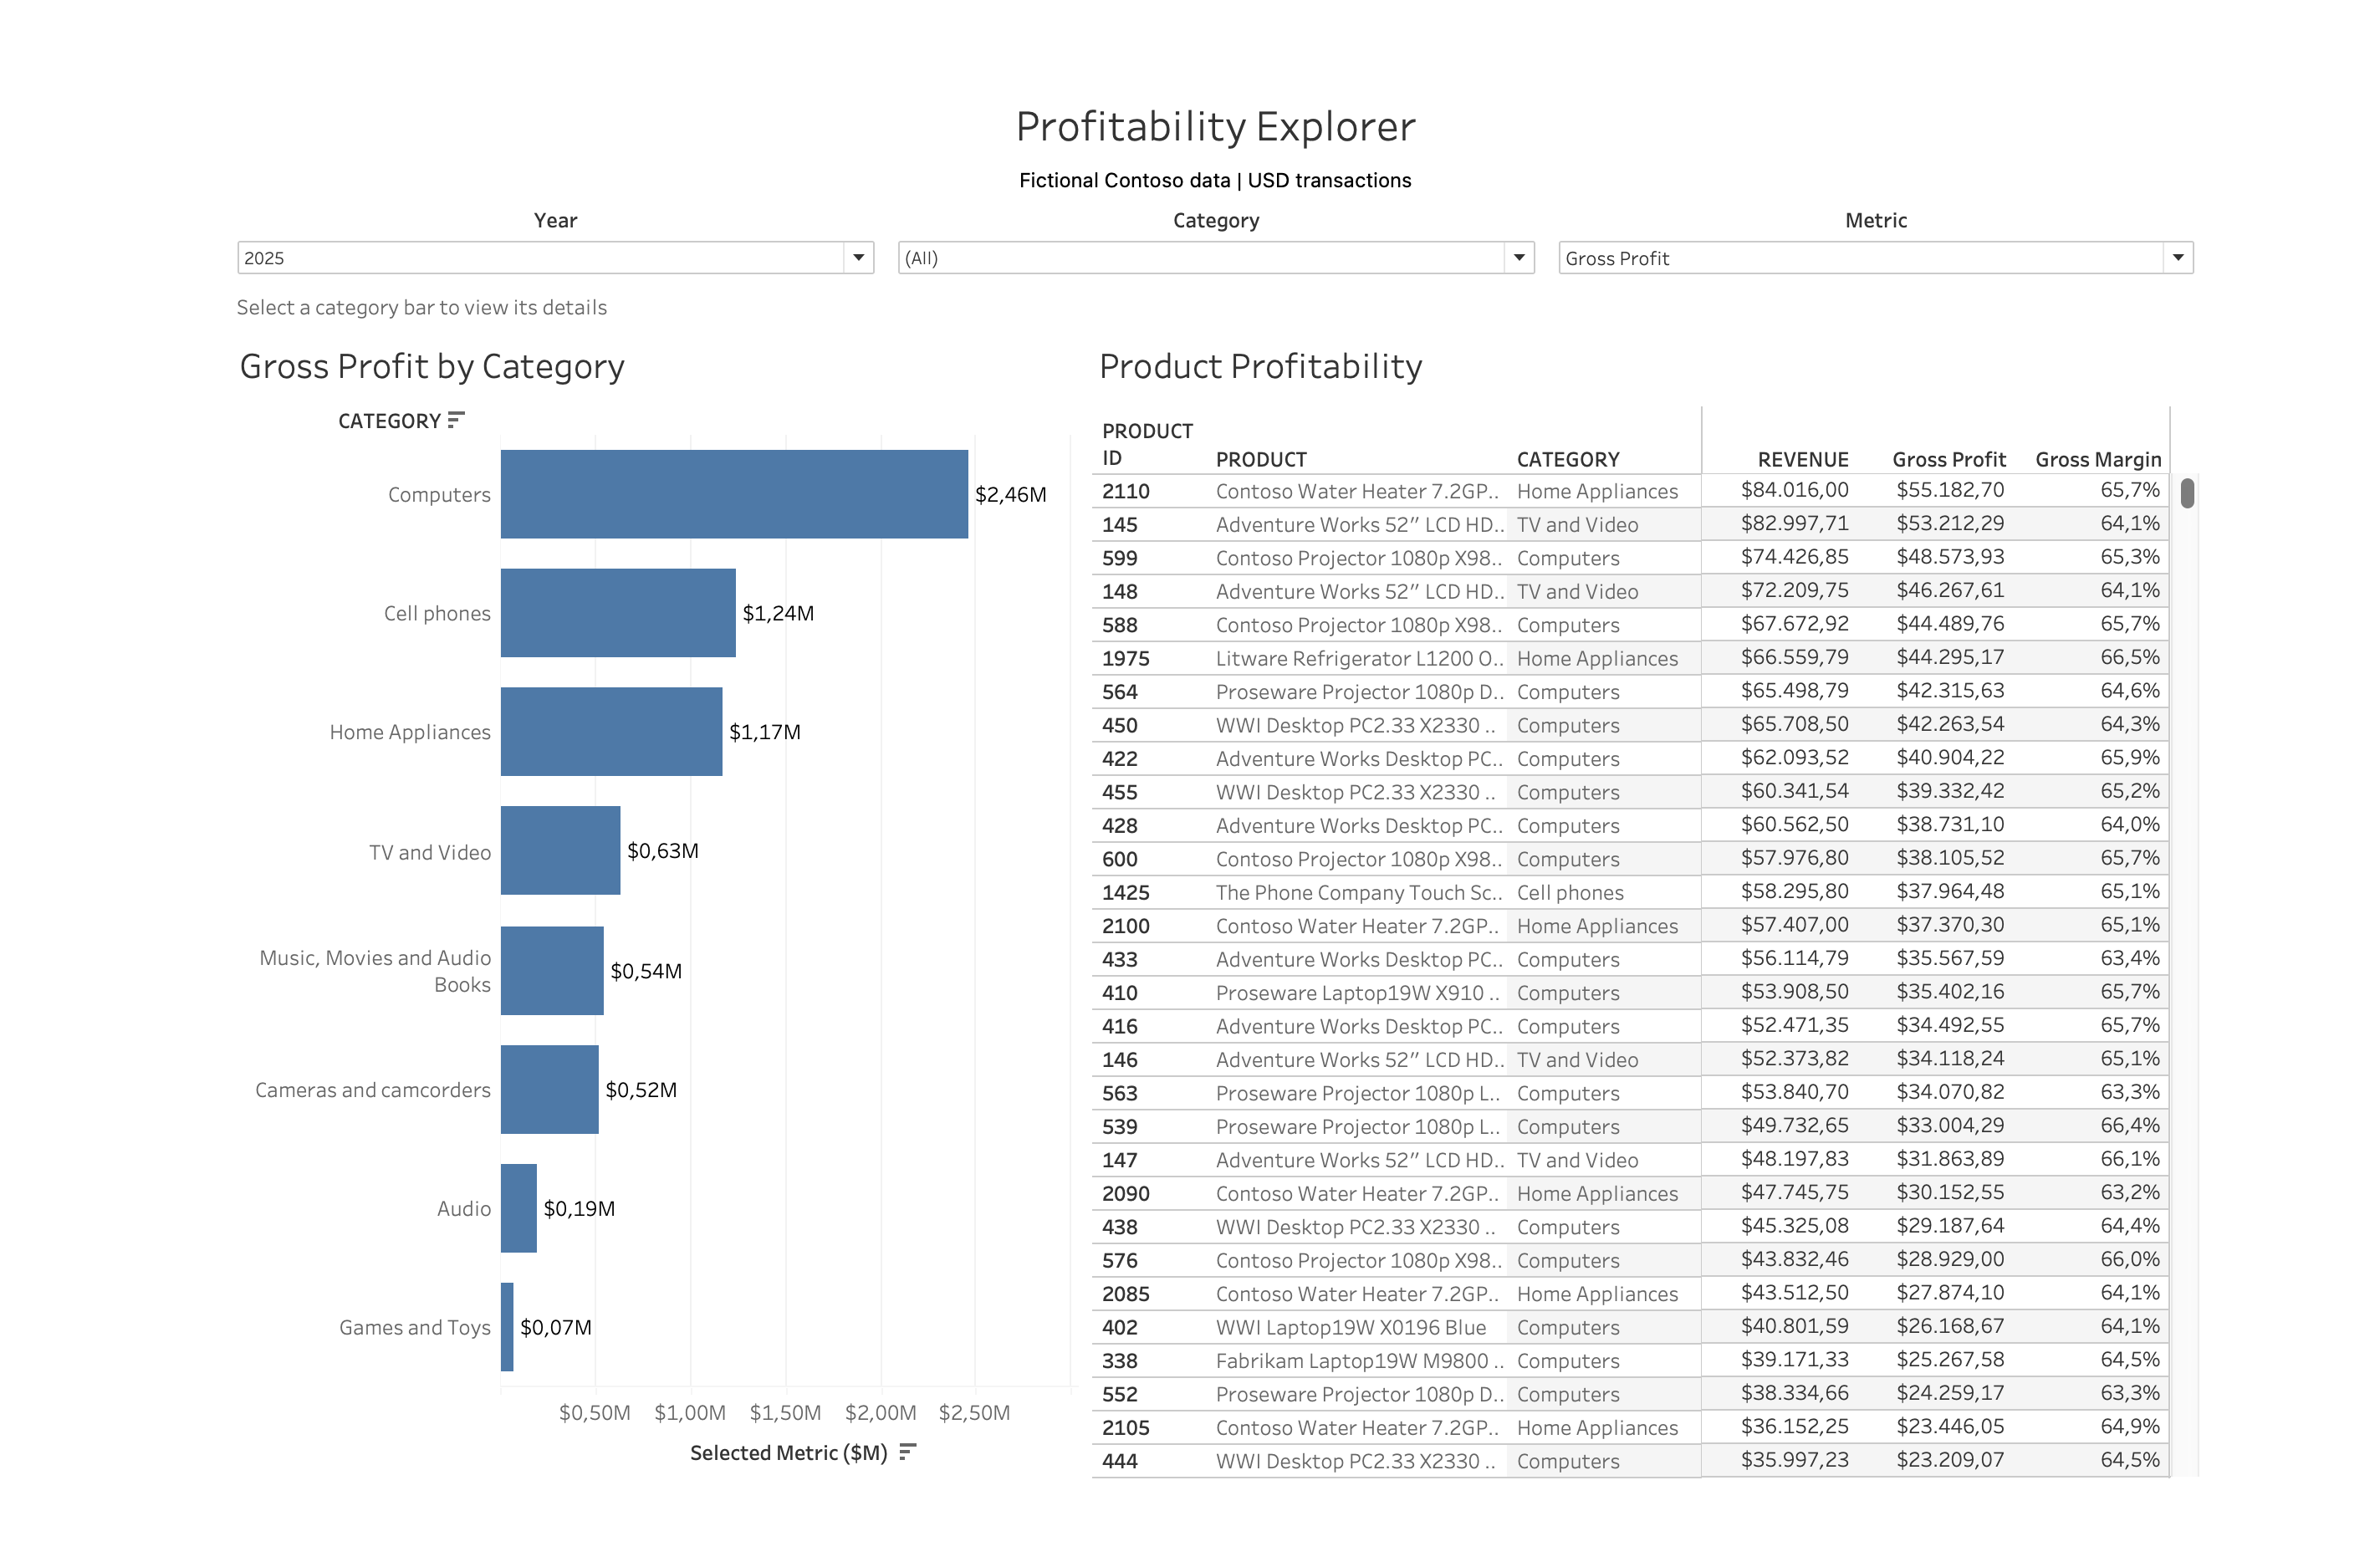
Computers contributed 36.1% of gross profit
The category generated $2,460,913.02 in gross profit. Its top 10 products accounted for 16.49% of the category's gross profit across 592 products with sales, so most of its contribution came from the wider product range.
02 / PRICE SCENARIO
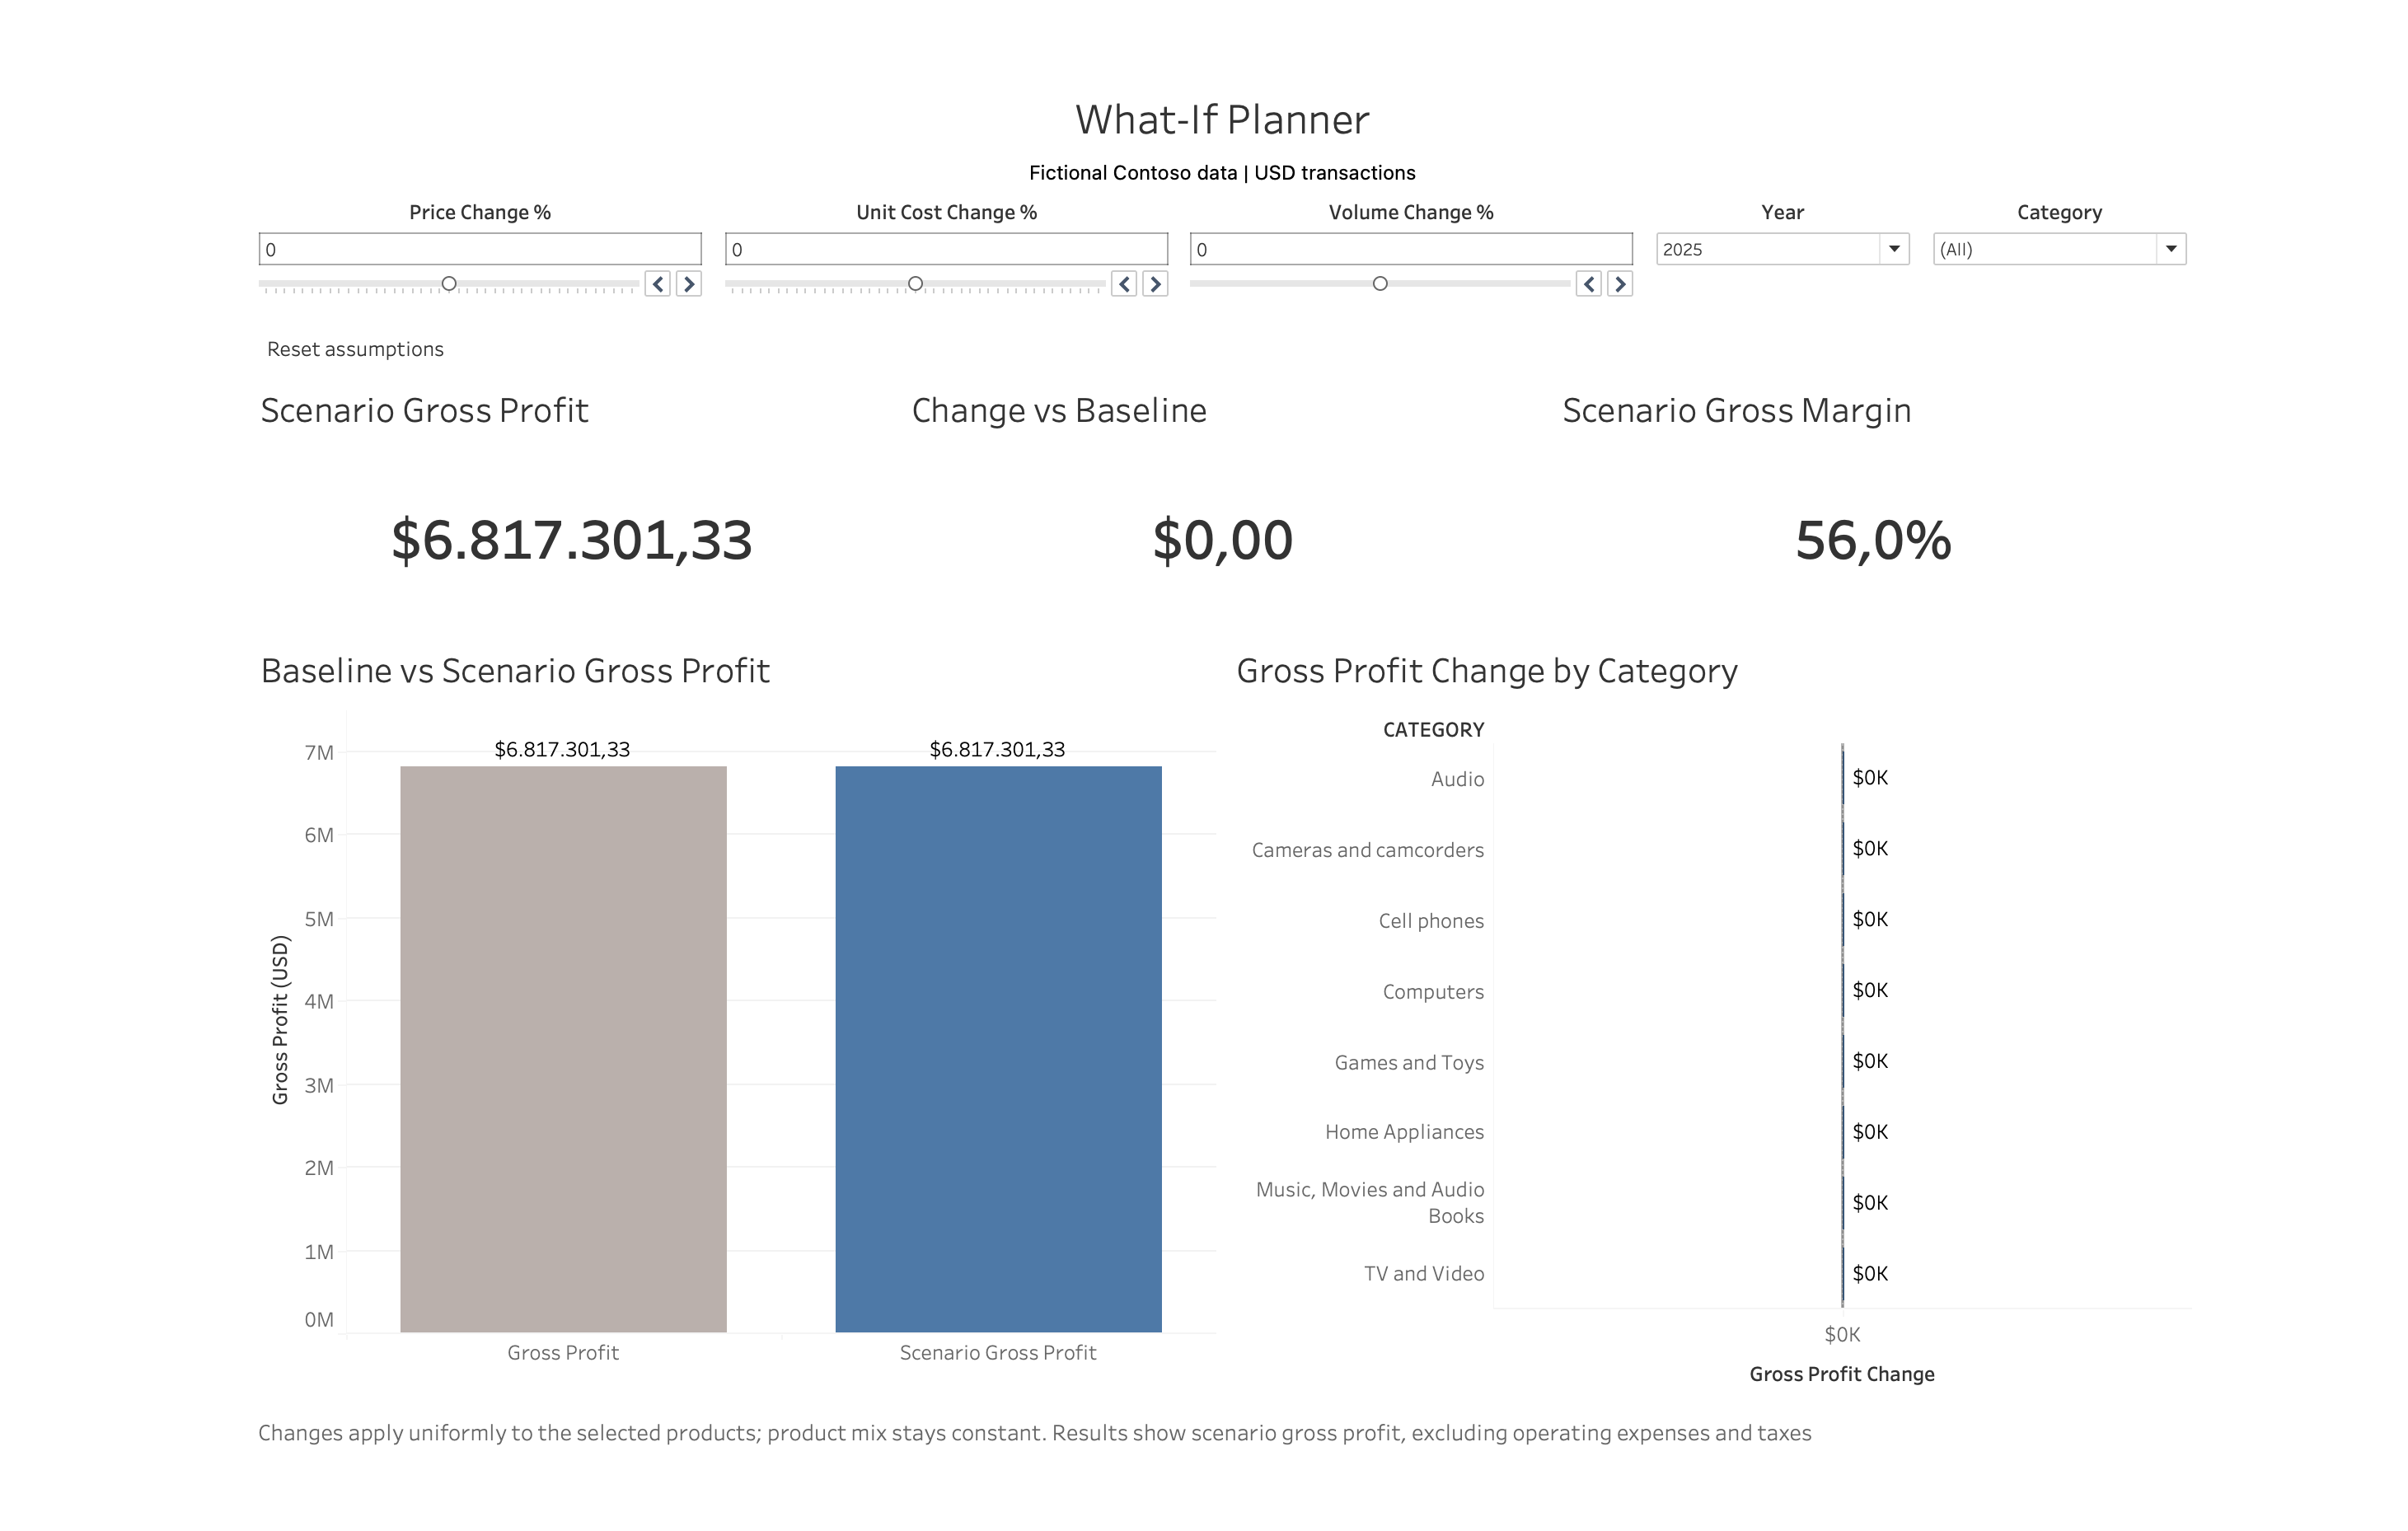
A 5% price increase added $608,812.52
With unit cost and volume unchanged, scenario gross profit rose from $6,817,301.33 to $7,426,113.85. This is a modelled result, conditional on maintaining the same volume and product mix.
03 / VOLUME SENSITIVITY
About an 8.2% volume decline removed that gain
Under the same price increase, gross profit stayed above baseline with a 5% volume decline, but fell below it with a 10% decline. The break-even point was about 8.2%; it is not a forecast of customer demand.
The table below keeps price at +5% and unit cost unchanged, then varies volume. All three cases use 2025 USD transactions and keep the product mix constant.
Baseline gross profit: $6,817,301.33
Volume change
Scenario gross profit
Change vs baseline
0%
$7,426,113.85
+$608,812.52
−5%
$7,054,808.16
+$237,506.83
−10%
$6,683,502.46
−$133,798.87
For me, the useful result was the trade-off: a higher price can improve gross profit, but the benefit depends on how much volume is retained. This model does not estimate how customers would actually respond.
HOW I BUILT IT
Preparing, checking, and presenting the data
Prepared the fictional Contoso tables in DuckDB and filtered the sales data to USD transactions.
Joined the required data at sales order line level, checking keys, missing values, and row counts.
Calculated revenue, COGS, gross profit, gross margin, and distinct order counts using consistent definitions.
Exported the prepared data and built the Financial Overview, Profitability Explorer, and What-If Planner in Tableau.
Compared dashboard totals with SQL reference results and checked the filters, scenario controls, and reset behaviour.
Used additional SQL analysis to examine product concentration and the volume break-even point.
This is an independent portfolio project using fictional data, rather than a report of a real company's performance. I kept USD transactions only and did not convert other currencies.
The planner applies uniform price, unit cost, and volume changes to the selected products. It keeps the product mix constant and does not model customer demand or inventory constraints. Gross profit excludes operating expenses and taxes.